Hypothesis Testing and p-values
Let's say you are a security guard at a high stakes casino in Las Vegas.
You play weird games at your casino. No card games, just coin flips. For each heads, you give the customer 20 thousand dollars, and each time they flip a tails, they have to pay you 21 thousand dollars. That's some high stakes coin flipping!
Even weirder, you let the customers bring in their own coins. Its your job as security guard to determine if customers are bringing in trick coins or not.
A new customer walks in and flips heads twice. Should you throw the cheater out?
Let's first walk through all the possible outcomes (of which they are four):
H H (or heads, heads)
H T (or heads, tails)
T H (or tails, heads)
T T (or tails, tails)
Since we only care about how the number of heads not the order in which they are flipped, we can summarize all the possible outcomes like so:
| Coin Outcomes | Fraction | Percent |
|---|---|---|
| Two Heads (H H) | 1/4 of outcomes | 25% of the time |
| One Heads (H T or T H) | 2/4 of outcomes | 50% of the time |
| No Heads (T T) | 1/4 of outcomes | 25% of the time |
That means, there is a 25 percent chance for two heads in a row because that outcome happens 25 percent of the time. That means he's a cheater right?
Calculating p values
Not so fast bucko.
A well trained security guard would know to use hypothesis testing and p-values to figure this out. Our hypothesis (which we will call the null hypothesis) will be that the patron is using a fair coin. Our p-value will tell us how unusual or rare it is for the above situation to occur under that null hypothesis.
P-values are determined by adding up three probabilities.
-
The probability that random chance would have resulted in what we observed
A fair coin would produce two heads 25% of the time
-
The probability that we would have observed something else equally as rare
A fair coin would produce two tails 25% of the time
-
The probability that we would have observed something even rarer
There is nothing more rare that a fair coin would do
Adding up our probabilities, we get a p-value of 0.5. In other words, a fair coin would produce an event as rare as two heads in a row 50 percent of the time.
Now our patron doesn't looks so bad, does he?
He Keeps Going....
Let's say that our customer just keeps flipping. He flips the coin another two times, resulting in three heads and one tails in total.
How many different possible outcomes are there for four different coin flips? We could map them out but that's a lot of writing, and it would be easier to say there are 24 or 16 potential outcomes.
I refuse to write out all the combinations, so you will just have to take my word for it when it comes to the fractions. Let's put that info into our table again.
| Coin Outcomes | Fraction | Percent |
|---|---|---|
| One Head (e.g. H T T T) | 4/16 of outcomes | 25% of the time |
| Two Heads (e.g. H H T T) | 6/16 of outcomes | 37.5% of the time |
| Three Heads (e.g. H H H T) | 4/16 of outcomes | 25% of the time |
| Four Heads (H H H H) | 1/16 of outcomes | 6.25% of the time |
| No Heads (T T T T) | 1/16 of outcomes | 6.25% of the time |
The goal of finding the p-value is to determine how rare the observed outcome is. Again, in order to calculate the p-values for our patron, we need to add together three probabilities.
-
The probability that random chance would have resulted in what we observed
A fair coin would produce three heads 25% of the time
-
The probability that we would have observed something else equally as rare
A fair coin would produce three tails 25% of the time
-
The probability that we would have observed something even rarer
12.5% of the time, a fair coin would do something even rarer like only heads or only tails
As a result, we have a p value of 0.625. This means that there is a 62.5 percent chance that a fair coin would do something as rare as produce three heads on four flips.
More generally, we could say the null hypothesis would produce an outcome this rare xyz percent of the time.
Now with Distributions
It's hard being a security guard at a high end coin flipping casino. You tell your boss that its completely unreasonable for you to watch ever single coin flip and calculate p values to test your null hypothesis. Instead you suggest that you can just check the earnings of patrons as they leave the casino.
You know that on average honest patrons loses 100 dollars at your casino, and earnings/losses for patrons follow a normal distribution.
You are checking the earnings of one customer on his way out and see that he earned $700 which would put him in the top 1.7 percent of patrons at your casino.
Is it clobbering time?
Here is where someone winning 700 dollars at our casino would fall on the distribution of our customers. His earnings are marked with a dotted red line below:
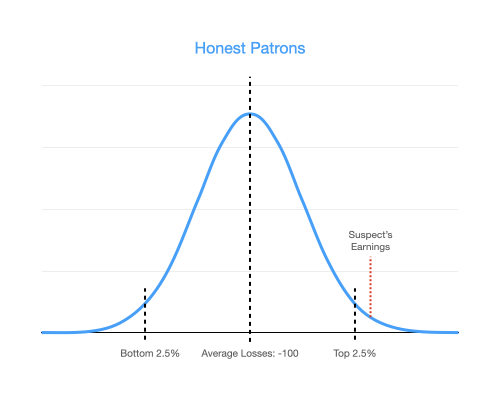
As you can see, our suspect is pretty far to the right on the distribution. In fact, only 1.6% of honest patrons earn more than he does. We may even suspect that (gasp) this patron may have brought in an unfair coin. If he is using an unfair coin, then we would belong to a different distribution-- a distribution of dirty liars!
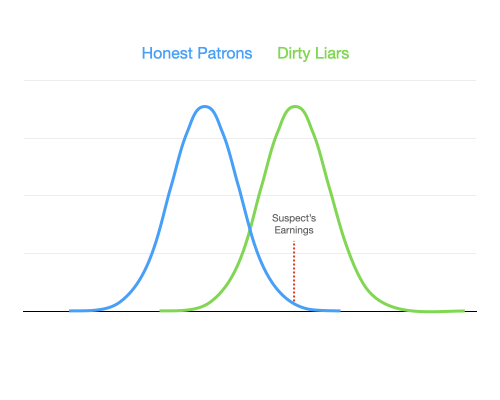
As you can see, if he was on the dirty liars distribution, then his earnings would be about average. But let's not throw him to the lions yet. We need to do hypothesis testing.
Our null hypothesis is that this dude belongs to the honest patron's distribution, and our p-value will tell us how often the honest patron's distribution will produce earnings as rare as his were
Remember, a p-value is the sum of three probabilities: (1) the probability that random chance would have resulted in the outcome, (2) the probability that random chance would have resulted in an equally unlikely outcome, and (3) the probability that random chance would have resulted in anything more rare.
Everything more rare than the suspects earnings is marked in red on the below distribution. Remember it's really rare to fall at or above top 1.7 percent of earners, but it's just as rare to fall into the bottom 1.7 percent of earners. To calculate the p-value then, we simply need to sum all the probabilities in red.
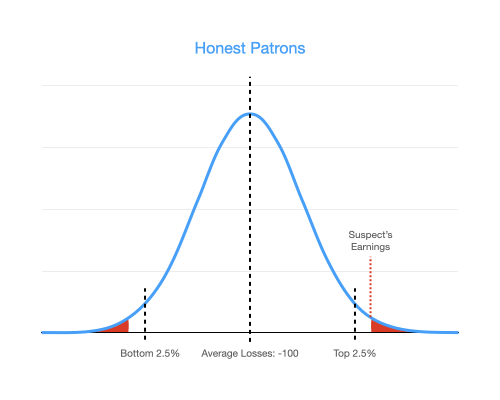
So if our suspect is in the top 1.7 percent of honest patrons, that would put his p-value at 0.034. In other words, assuming that he is an honest patron, we would see earnings that unusual 3.4 percent of the time.
At the Lucky Coin (that's the name of this made up casino), we only allow patrons to keep their earnings when their earnings have a p-value above 0.05, so congratulations, it is in fact clobbering time.
What Exactly Does a P-Value Tell Us?
You may want to vomit when I tell you this again, but p-values tell us how rare an observed outcome is, assuming that the null hypothesis is true.
If someone flips three heads in four flips, that's not that rare of an outcome. In fact, four flips will produce an outcome at least that rare 62.5 percent of the time.
If someone happens to fall into the top 1.7 percent of earners, that's pretty rare. It's equally as rare for someone to fall into the bottom 1.7 percent of earners, meaning that 3.4 percent of the time our null hypothesis will produce an outcome that unusual.
This doesn't mean that being in the top 1.7 percent of earners automatically makes you a cheater though. In fact, deciding when to throw out the null hypothesis (or a guest at a casino) is a judgement call. It is common practice however to throw out the null hypothesis when the p-value is less than 0.05.
And that's p-values! They are probably one of the most used measures of validity in statistics, but I would hazard to guess that most people don't full understand what they are or how to calculate them.
Not you though, you read this whole thing.