Linear Regression
If you know anything about statistics, you likely know linear regression. If you took Econ 101, you were likely introduced to linear regression. If you ever had to make a quick and dirty model in excel, then your best friend was most likely Mr. Linear Regression.
He's always been there for you. From your very first client engagement to your first cut at making a prediction on a new dataset. You've always relied on him.
But how well do you really know Mr. Linear Regression? How does he feel? What's his story? Don't you think its time to get to know Mr. Linear Regression just a little bit better?
Well luckily for you, today's lesson is all about getting to know Mr. Linear Regression really well.
Fitting a Line to Data
Let's say you are a famous YouTuber who is also very data driven. You are looking through your stats and you notice a very curious pattern. The more comments a video gets, the more views that video will have.
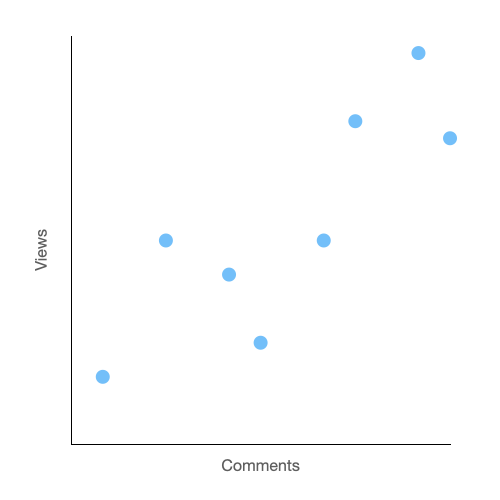
Ok maybe this discovery isn't about to rock the foundations of the YouTube community. But what if you could create a trend line that would predict the exact number of views given the number of comments? How would we draw such a line. More to the point, what would the slope of that line be?
Let's start by just drawing a line whose y value is always the average number of views. We are going to call this line the prediction line because the goal of this whole thing is to be able to make predictions with it.
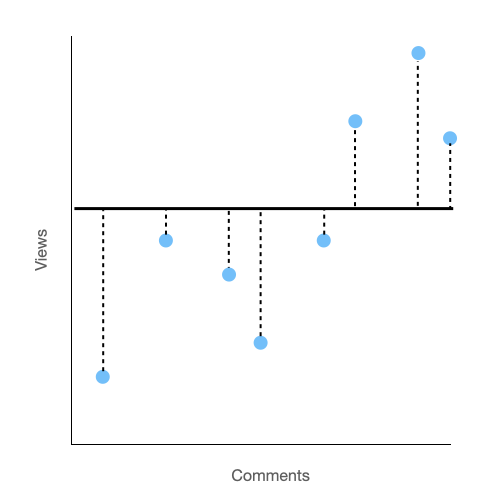
If we are trying to use this line to predict the number views based on the number of comments, then the difference between the prediction line and the actual number of views would be the error. Another term for this is the residuals.
We are going to denote the residuals with a dotted line. The longer that dotted line, the greater the residuals. If we sum up the total length of the dotted lines, we will have total amount we were off in our prediction. Mathematically, we will actually square the residuals before summing them. This is to make sure that negative residuals don't cancel out positive ones. For short hand, we will call this the sum of the squared residuals. Just remember to think of this as the total error.
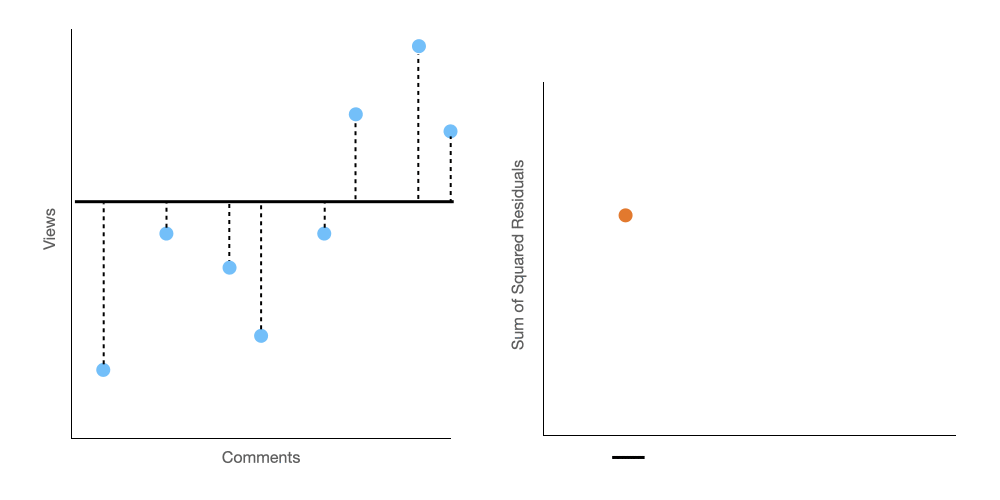
The best prediction line will be the line that minimizes the sum of the squared residuals. This is also called the line of best fit.
To find the line of best fit, we are going to do two things. (1) we are going to keep changing the slope of our line, and (2) we are going to keep track of the sum of the squared residuals.
Below, on the left panel, you can see how we twist the prediction line, and on the right panel, we plot the sum of the squared residuals on a graph.
It seems pretty obvious looking at that right panel, that we should stop twisting the prediction line on our third iteration, because at that point the sum of the squared residuals is lowest. Easy right?
Not so fast, hotshot.
We are only showing five possible slopes on that graph. But a line can have an infinite number of slopes right? Perhaps it's better to think of that chart as a curve rather than five distinct points.
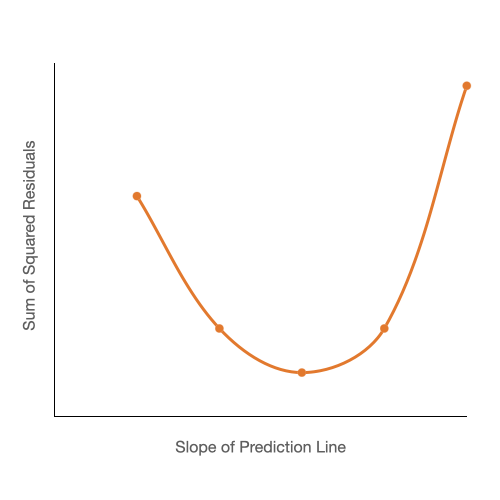
Ok, in that case, it's seems pretty obvious that we should be trying to find the bottom of the curve right? Well, we will need calculus to do that. Oh fuck.
Take a deep breath and remember that I am not going to make you do any math. We are here for the concepts.
We will take the derivative of the function that produces the curve we see above. The derivative will give us the slope for each point along the curve and where the slope is equal to zero will be the bottom of the curve. Just take a look at the below gif for proof.
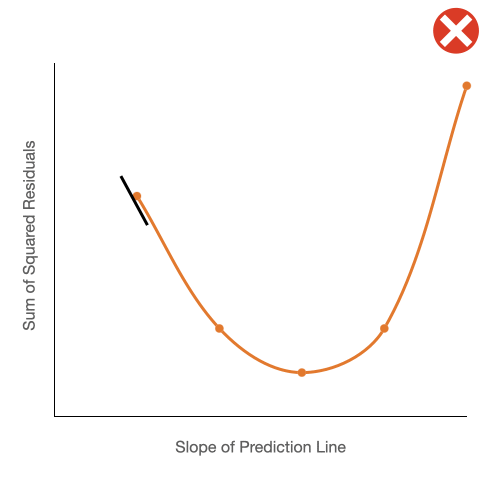
Remember that x axis of our graph corresponds to a slope for our prediction line, which is of course, what we've been looking for.
And there you have it. That's how you fit a line to a set of data.
Almost always, unless you are a true masochist, you will use a computer program to fit a trend line to your data, so in reality you don't really need to know any of this. But remember, this about getting to know Mr. Linear Regression really well.
Making Predictions with the Line
We have finally fit the line to the data. Now we get to actually use the line. This is the easy part. Given an arbitrary number of comments, you can trace your way straight up to the prediction line from the x axis and then straight over to the y axis for your predicted number of views. Follow the dotted lines from a starting point on the x axis and then trace up to the corresponding spot on the y axis.
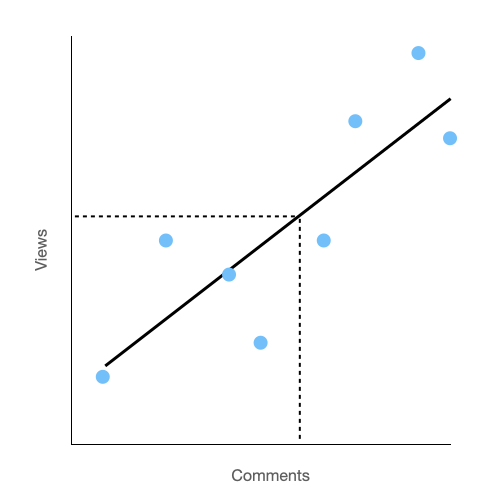
You may remember from math class the formula, y = mx + b. It's the same thing here. "b" is the y intercept, m is the slope of the line and x is the number of comments.
So for example, if you had no comments at all on your video, you would expect the number of views to be the y intercept of your line. Because it's a line, its infinite. You can take any random number of comments and use that to predict a number of views.