K Means Clustering
You may have heard the term marketing segmentation bandied about in meetings and conference calls, and despite knowingly nodding along, you may have wondered, "what exactly are market segments, and where do they come from?" One such method for market segmentation is k-means clustering and luckily for you, that's what this explainer will cover.
Market segmentation is the process of dividing a largely heterogenous population into a number of smaller, homogenous populations. When a population is heterogenous, two random observations are unlikely to have much in common. By contrast, two observations in a homogenous population will have a lot in common.
Let's take a dataset with two variables, age and healthcare spending. Right now, the observations are heterogenous. If you grabbed two of them, then it's not very likely that you will grab two observations that are young people with low healthcare spending. Why does this matter?
Imagine you are trying to design health insurance plans. If you could sort your customers into different buckets than you could tailor plans for each bucket. An older population may want a plan with a lower deductible and higher premiums while a younger population might want a high deductible and lower premiums.
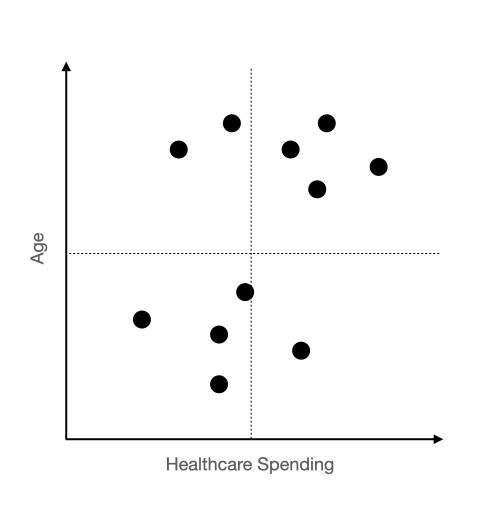
Looking at our customer data, it's pretty obvious how we should divide our customers. There appears to be an older population that on average spends more on healthcare and a separate younger population that spends less on healthcare.
If this was split into those two groups, then the observations would be reasonably homogenous. Any given observation within a group would look reasonably similar to another observation in that group.
When that is the case, we have something called intra-cluster similarity, which we will return to later.
The question then is, how can we write an algorithm to sort these observations into groups with high intra-cluster similarity?
Iterative Centroids
Iterative centroids? What a section title! Next time someone smugly throws out the term market segmentation in a meeting, you can fire back, "why don't we use an iterative centroid approach to do that segmentation?" And then the whole office will cheer as you lifted onto their shoulders and crowned the new king of buzzwords.
K-means clustering is actually very simple to understand. Its based on splitting your dataset into clusters and iteratively finding the centers of those clusters. As the centers of the clusters change, the membership of the clusters will change as well, and as the membership of the clusters change, so too do the centers. This goes on and on until it reaches an equilibrium.
Thats a lot of words, and it's much easier to see it in action. So let's walk through an example.
Step 1 Randomly Place Centers:
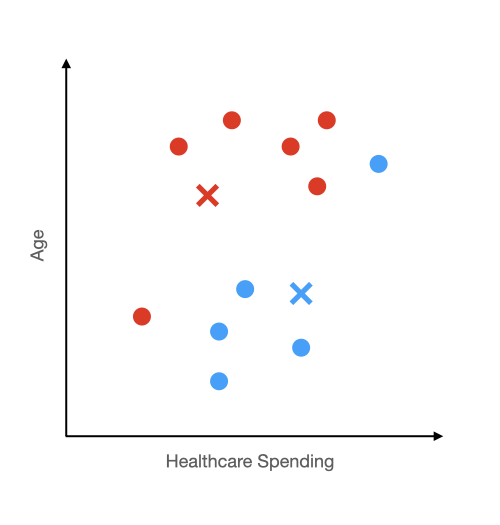
First we assign random points to be our "centroids" (lets stop the buzzword shenanigans and call them centers from now on). We will denote the center of a cluster with an x. We could put these centers anywhere on this plot and in the end our algorithm will figure out the appropriate clusters.
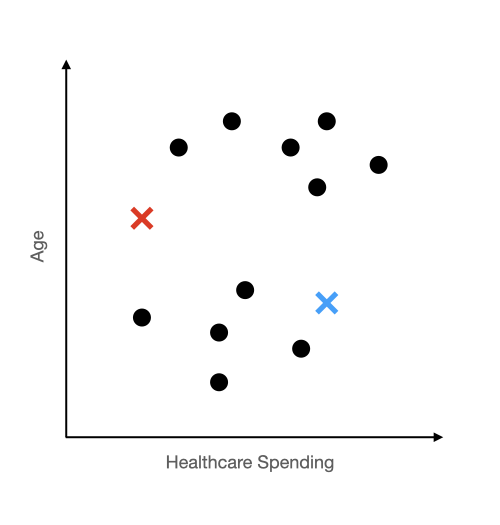
Step 2 Assign Groups: After we have randomly placed our starting centers, we will assign each observation to a group based on which center it is closer to. So in this example, we randomly put down a red x and a blue x. Then we assigned each dot a color based on which x it was closer to.
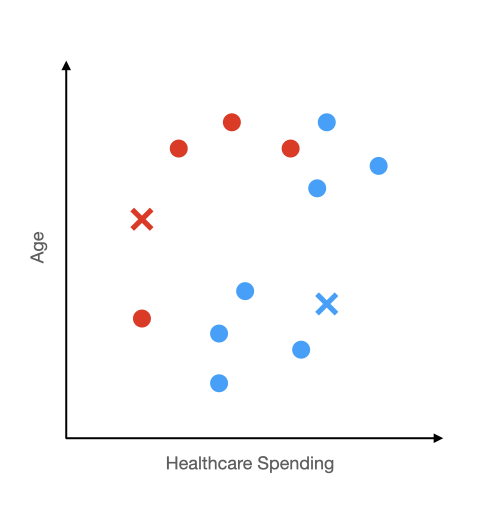
Step 2 Recalculate the Centroids:
Next, you will recalculate the center of each group. For the red group, you are trying to place the x in the center of the four red dots that you see. The same goes for the blue group. The red center will move up and to right because three out of four points are up and to the right. The blue center will barely move because there is an almost even number of points above and below it.
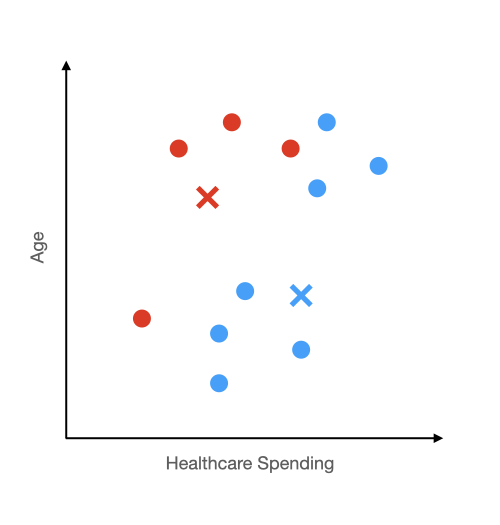
Step 3 Recalculate the Groups:
Now that we have moved the centers, the closest center for some of these dots will have changed as well. For example, two blue dots will turn red because they are now closer to the red x than the blue x.
Step 4 - Infinity: Repeat Steps 2 & 3
Now that the composition of the red and blue group has changed, so too will the centers of those groups. As such, we will need to recalculate the centers again. Once we recalculate the centers, you guessed it, we will need to reassign the groups. We keep doing this until an equilibrium is reached. Once a new center is assigned and none of the dots switch groups, we have found that equilibrium.
Let's pull it all together and see how changing the centers changes the groups. And how changing the groups changes the centers.
How Many Clusters
At the beginning we made a very important assumption. We told the algorithm to split the data into two clusters. The number of clusters to split the data into is the only input besides the data that a k-means algorithm needs, and that argument is called the k number, which is where the "k" in "k means" comes from.
Earlier we talked about intra-cluster similarity, which is a measure of how homogenous a cluster is, but how do we measure such a thing?
We measure the distance of all the points in a cluster from its center, square them, and then sum them up. In the below plot, the dotted lines represent the distance between the points and the center.
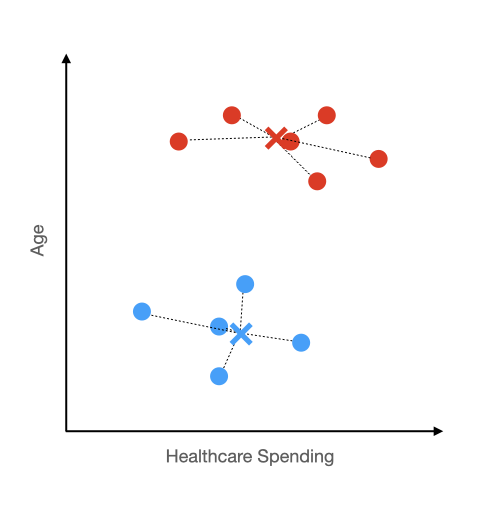
As you can guess, you want to minimize the summed distance of each point from the center to increase the intra-cluster similarity. The way you do that is by increasing the number of centers. If there was four centers (k = 4) then it would take less distance to get from each point to its closest center. Taken to the extreme, if each observation was a center, then it would take no distance at all to get from the observation to the closest center.
That extreme case also points us to an important trade off.
If every observation is its own cluster, then what makes the clusters different from each other? Not much. As we increase the number of clusters, we tend to make each cluster more similar to other clusters. How similar clusters should be to each other is called inter-cluster similarity, and we want that to be low (because we want each cluster to be distinct).
Let's go back to the example of setting k = 4.
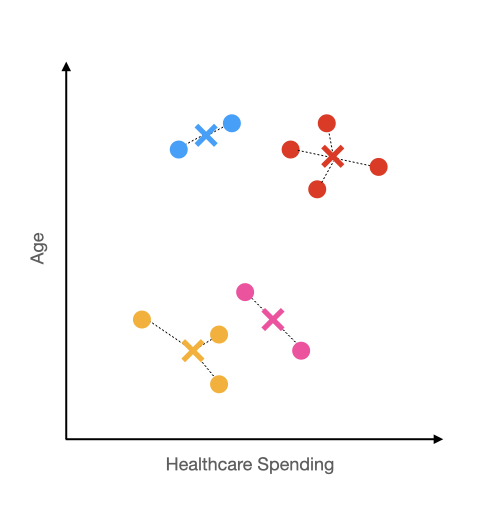
In this case, we can see that the intra-cluster similarity is high because it doesn't take that much distance to get from the points to their respective centers. But this comes at the cost of having distinct clusters. The pink and yellow group look pretty similar to me, and the difference between the blue and red group is much less than the red group and the yellow or pink group.
So mathematically, how will decide how many clusters to include?
One way we can find the appropriate k number is with an elbow plot. Essentially what we will do is run our k-means algorithm a bunch of times (in the below example six times) and then plot the sum of the squared distances for each k-number on the y-axis.
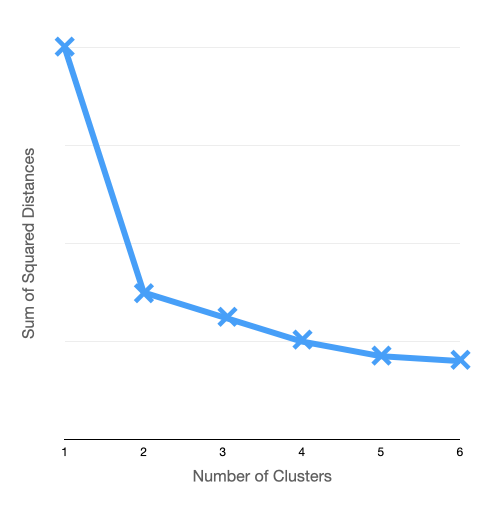
So when we only had one group (k = 1), the sum of the squared distances was quite large, and when we had six groups (k = 6), the sum of the squared distances was quite small. Notice how there appears to be some diminishing returns here. Increasing the number of cluster from five to six barely increases the intra-cluster similarity, but since we are adding another group, we are also increasing the inter-cluster similarity.
You should always choose the number of cluster where you get the most intra-cluster bang for you inter-cluster buck, and that would be where the bend in the curve is, which is also called the elbow of the elbow plot. So in this example, that would mean you set k = 2.
Ok So What?
Ok now we have some clusters. What should we do with them?
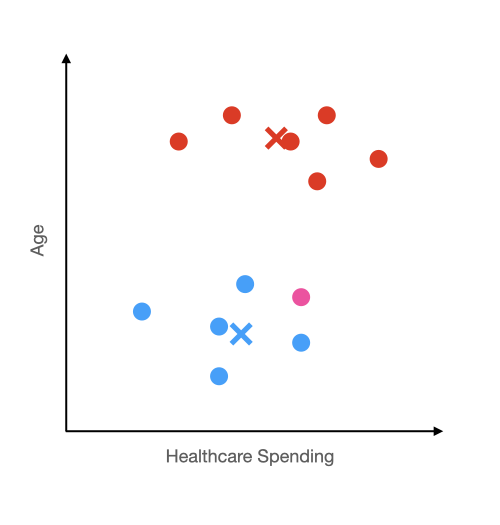
Imagine we made healthcare plans around the clusters we created. One "blue" plan for younger people who don't typically need coverage, and one "red" plan for older folks who more often need coverage. A new customer comes into the system (represented by the pink dot), we can recommend what plan they should purchase based on what center they are closer to. In this case, the blue plan.
Here's another use case. But this time without an accompanying visual (sorry, I'm tired of creating them).
Imagine you are Netflix and each dot was a movie. If a user clicked on a movie, you could recommend them another movie from the same cluster.
Movie magic? Nope, statistics magic (ie the best kind of magic).