Classification Tree
By the end of this tutorial, you will come to respect your computer a little more. The amount of arithmetic needed to complete a basic classification tree is significantly higher than a human should subject themselves to. I don't want to imagine the world where something like this is done by hand. It would be a cold and desolate land.
Regardless of how miserable that would be, we are going to learn how one would calculate a decision tree by hand en route to learning its old and more popular brother, the random forest.
Whats a Decision Tree (In General)?
Have you ever seen those plinko games, where you put a puck at the top of a board, and the puck bounces around until it lands in a slot (usually with some denomination of money to win at the bottom)?
Well if you haven't here's a gif.

A decision tree is kind of like this. But instead of being random, the puck goes left or right depending on its characteristics. Enough with the game show metaphors. Let's go over the components of a decision tree.
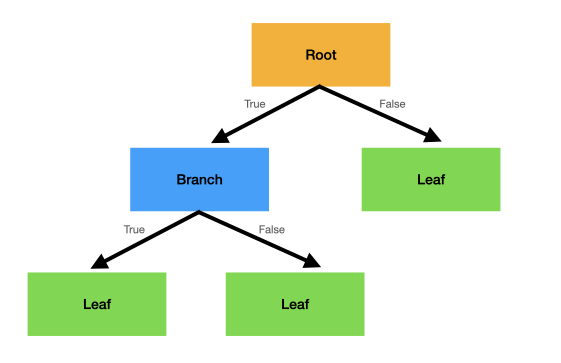
First, there are the nodes. Nodes that are used to split the data on an attribute, usually by asking a yes/no question, are called branches. The very first branch has its own name. It's called the root. Finally there are leaves which are the end points of trees.
Now that we have breezed our way through some basic terminology, let's use a decision tree to determine if you are a heavy emoji user.
Building a Tree
Let's start from scratch a build a tree from raw data. Let's say we have three independent variables and one dependent variable.
| Owns Phone | Downloaded TikTok | Age | Emoji User |
|---|---|---|---|
| No | Yes | 10 | Yes |
| Yes | Yes | 17 | Yes |
| Yes | No | 24 | Yes |
| Yes | Yes | 39 | Yes |
| Yes | No | 46 | Yes |
| Yes | No | 52 | No |
| No | No | 56 | No |
| Yes | No | 85 | No |
| Yes | Yes | 88 | Yes |
Based on if someone owns a phone, if they downloaded TikTok, and their age, can we use a decision tree to predict if they are an emoji user?
Here is what a decision tree might look like for this data:
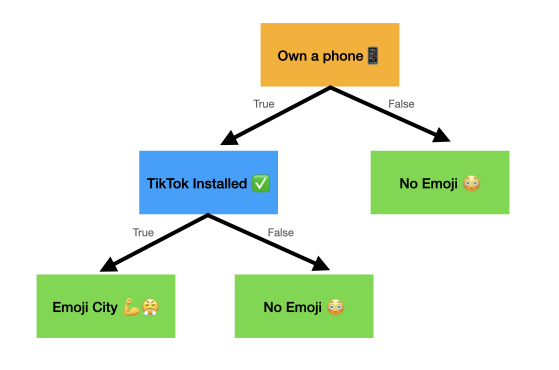
Which question should be put as the root node? Well, whatever attribute is the best predictor for emoji usage should be the root node. To find that, we are going to measure how well each variable predicts emoji usage.
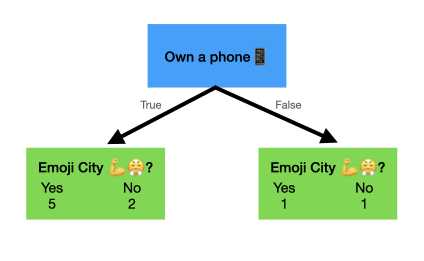
Let's start with owning a phone and downloading TikTok.
For those users who do own a phone five of them are certified citizens of Emoji City 💪😤, and two of them are sad basement dwellers who don't use emojis. On the other hand, of the two people without phones, one still manages to use emojis. What a boss 😎.
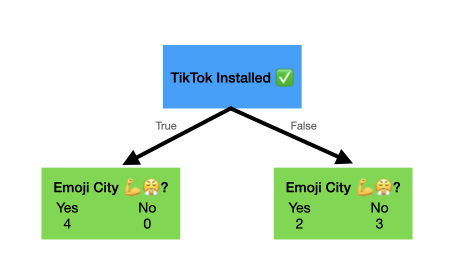
For those users who have downloaded TikTok, all four of them are commanders in the emoji brigade 💯. For those users who have not downloaded TikTok, we have two emoji users and three just-text-for-me sad boys who do not use emojis.
Impure Leaves
You'll notice that some of the leaves have a mixture of people who do and do not use emojis. These are impure leaves. The leaf representing those who have TikTok installed is pure because it just has one type of individual (those who do use emojis).
It makes sense that purer leaves do a better job of making predictions. If a leaf indicates that something is always true, then obviously its a more reliable predictor than something that is only true 50 percent of the time. We will use Gini Impurity to measure how pure a leaf is.
The formula for Gini Impurity is as follows:
Gini Impurity = 1 - (Probability of True)^2 - (Probability of False)^2
The goal of this formula is simply to find out how mixed something is. For example, if everything was true, then the Gini Impurity would be 0. The same is true if everything was false. If there was an even mix between both true and false, then the Gini Impurity would be 0.5. Basically, we would like this number to be as low as possible.
Let's calculate this for the leaves on the "Owns Phone" tree. First where it is true:
Gini Impurity = 1 - (5/7)^2 - (2/7)^2 = 0.41
Next for where there are no phones:
Gini Impurity = 1 - (1/2)^2 - (1/2)^2 = 0.5
Now that we have the Gini Impurity for both the leaves, we need to calculate the weighted mean between those two. There are nine total people in our data, seven with a phone and two without. So the weighted average is as so:
Weighted Gini Impurity = (7/9)*0.41 + (2/9)*.5 = 0.43
And there you have it. The Weighted Gini Impurity for phone ownership is 0.43 💅.
We are going to repeat the same steps for TikTokers.
1) Gini Impurity for Having the Tok = 1 - (4/4)^2 - (0/4)^2 = 0
2) Gini Impurity for No Tok = 1 - (2/5)^2 - (3/5)^2 = 0.48
3) TikTok Weighted Gini Impurity = (4/9)*0 + (5/9)*0.48 = 0.26
From this, it looks like TikTok is a better predictor of emoji use because it has on average purer leaves than phone ownership.
Gini Impurity for Continuous Variables
Nodes can be split based on a yes/no attribute. For a binary variable building a yes/no split is obvious (e.g. "do you own a phone"). Whereas for a continuous variable, it is considerably less so.
We could simply say, "is the user younger then average age of the dataset?" And that would turn our continuous variable into a yes/no question.
By why is the average age the best threshold to split on? Is there a chance that a different threshold would yield a lower impurity score? Spoiler, there is and we are going to find it.
First calculate the average age for each two adjacent observations (e.g. the average of 10 and 17 is 13.5):
| Age | Average Age | Emoji User 🤔? |
|---|---|---|
| 10 | Yes | |
| 17 | 13.5 | Yes |
| 24 | 20.5 | Yes |
| 39 | 31.5 | Yes |
| 46 | 42.5 | Yes |
| 52 | 49 | No |
| 56 | 54 | No |
| 85 | 70.5 | No |
| 88 | 86.5 | Yes |
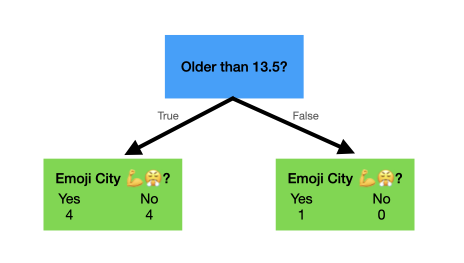
Next we calculate the Gini Impurity value for the "Average Ages". For example, we will put "Is the person older than 13.5" at the root node and calculate the Gini Impurity just like before:
We then do this for every single average age. You can imagine how painful this would be in a large dataset, but luckily we actually have a pretty small dataset.
The results look like so:
| Average Age | Gini Impurity |
|---|---|
| 13.5 | .417 |
| 20.5 | .381 |
| 31.5 | .333 |
| 42.5 | .267 |
| 49 | .167 |
| 54 | .333 |
| 70.5 | .429 |
| 86.5 | .417 |
Looking from this data, we see that we actually get really low impurity when we split the data based on if someone is older or younger than 49! In fact, this is the lowest Gini impurity score we have seen thus far--even lower than whether or not the individual has a TikTok! As such, it will serve as the root of our tree.
So What's the Second Split?
At this point in time, our tree looks like so:
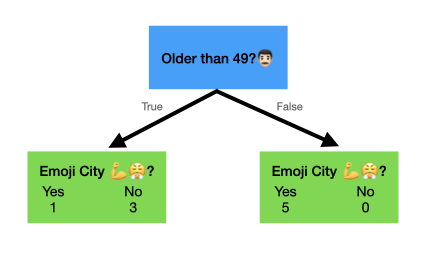
On the left side, we have the four people who are older than 49. One of them use emojis and three of them do not. On the right side, we have five people who are younger than 49 and they all use emojis 😎.
That's a pure leaf! We won't get anymore information by splitting those five people on a second attribute (like whether or not they own a phone) because they all use emojis.
So we are done with that side of the tree.
On the other side, we need to decide whether or not to split by TikTok or Phone Ownership, and we will do that by calculating, you guessed it, Gini Impurity Scores.
So for four people in the over 49 crowd, if we split on phone ownership next, our tree would like this:
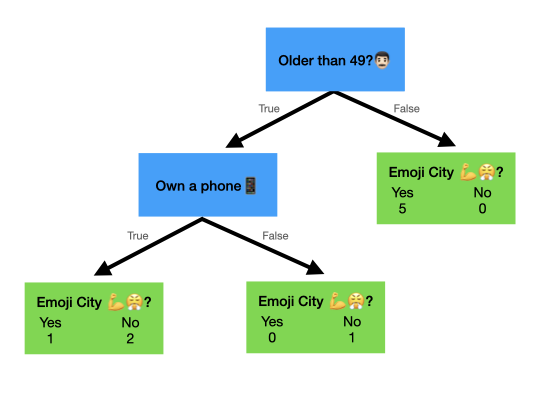
And we calculate the Gini Impurity like so:
No phone: 1 - (0/1)^2 - (1/1)^2 = 0
Phone: 1 - (1/3)^2 - (2/3)^2 = 0.44
Weighted Gini Impurity = (3/4)*0.44 + 0 = 0.33
Alternatively, if we split on TikTok next, our tree would like this:
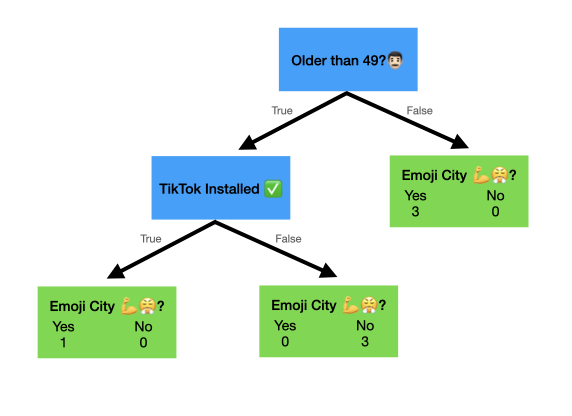
And the Gini Impurity would be like so:
No Tok: 1 - (0/3)^2 - (3/3)^2 = 0
TikTok: 1 - (1/1)^2 - (0/1)^2 = 0
Weighted Gini Impurity = 0 + 0 = 0
Amazing! All the leaves on the TikTok branch are pure. It's almost as if someone painfully reworked the example data to make it so.
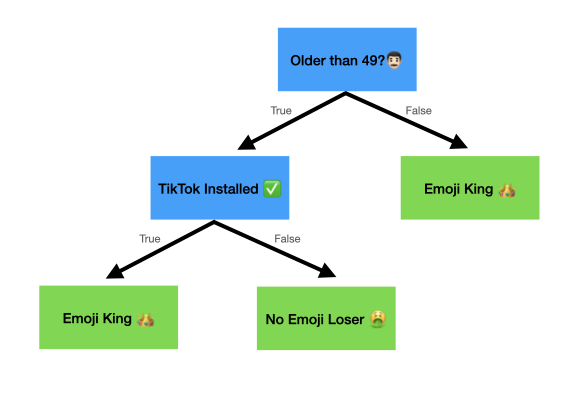
Because both the leaves are pure, we do not need to further split the tree by Phone Ownership since that will not provide anymore information. And so our final tree looks like this!
How is this Useful?
Let's imagine that we meet a new person (scary I know), and we have to guess if they use emojis. They dutifully report that they are 53 and have TikTok installed. Well, we can run them down our decision tree to find that they are in fact a fellow Emoji King 👑!
But there is a huge draw back to using decision trees like this. They overfit to data really easily. Because you are dividing and subdividing your data repeatedly, the group size at the leaves can be really small, and a small group size is never a good thing in statistics.
For example, right now, we only have two people over 49 with TikTok installed. What if another two came along and didn't use emojis? Our model would mess both of those up.
Be very careful when working with smaller datasets and using classification trees.