Modularity
An essential task in graph data science is to find communities with your graph. In unneccesary data science speak this is called graph partitioning, which is just splitting your graph into different clusters, bubbles or communities. Really whatever you want to call it.
But how can we tell how good of a job we did in splitting our graph into clusters?
Enter modularity. Let's consider the below graph:
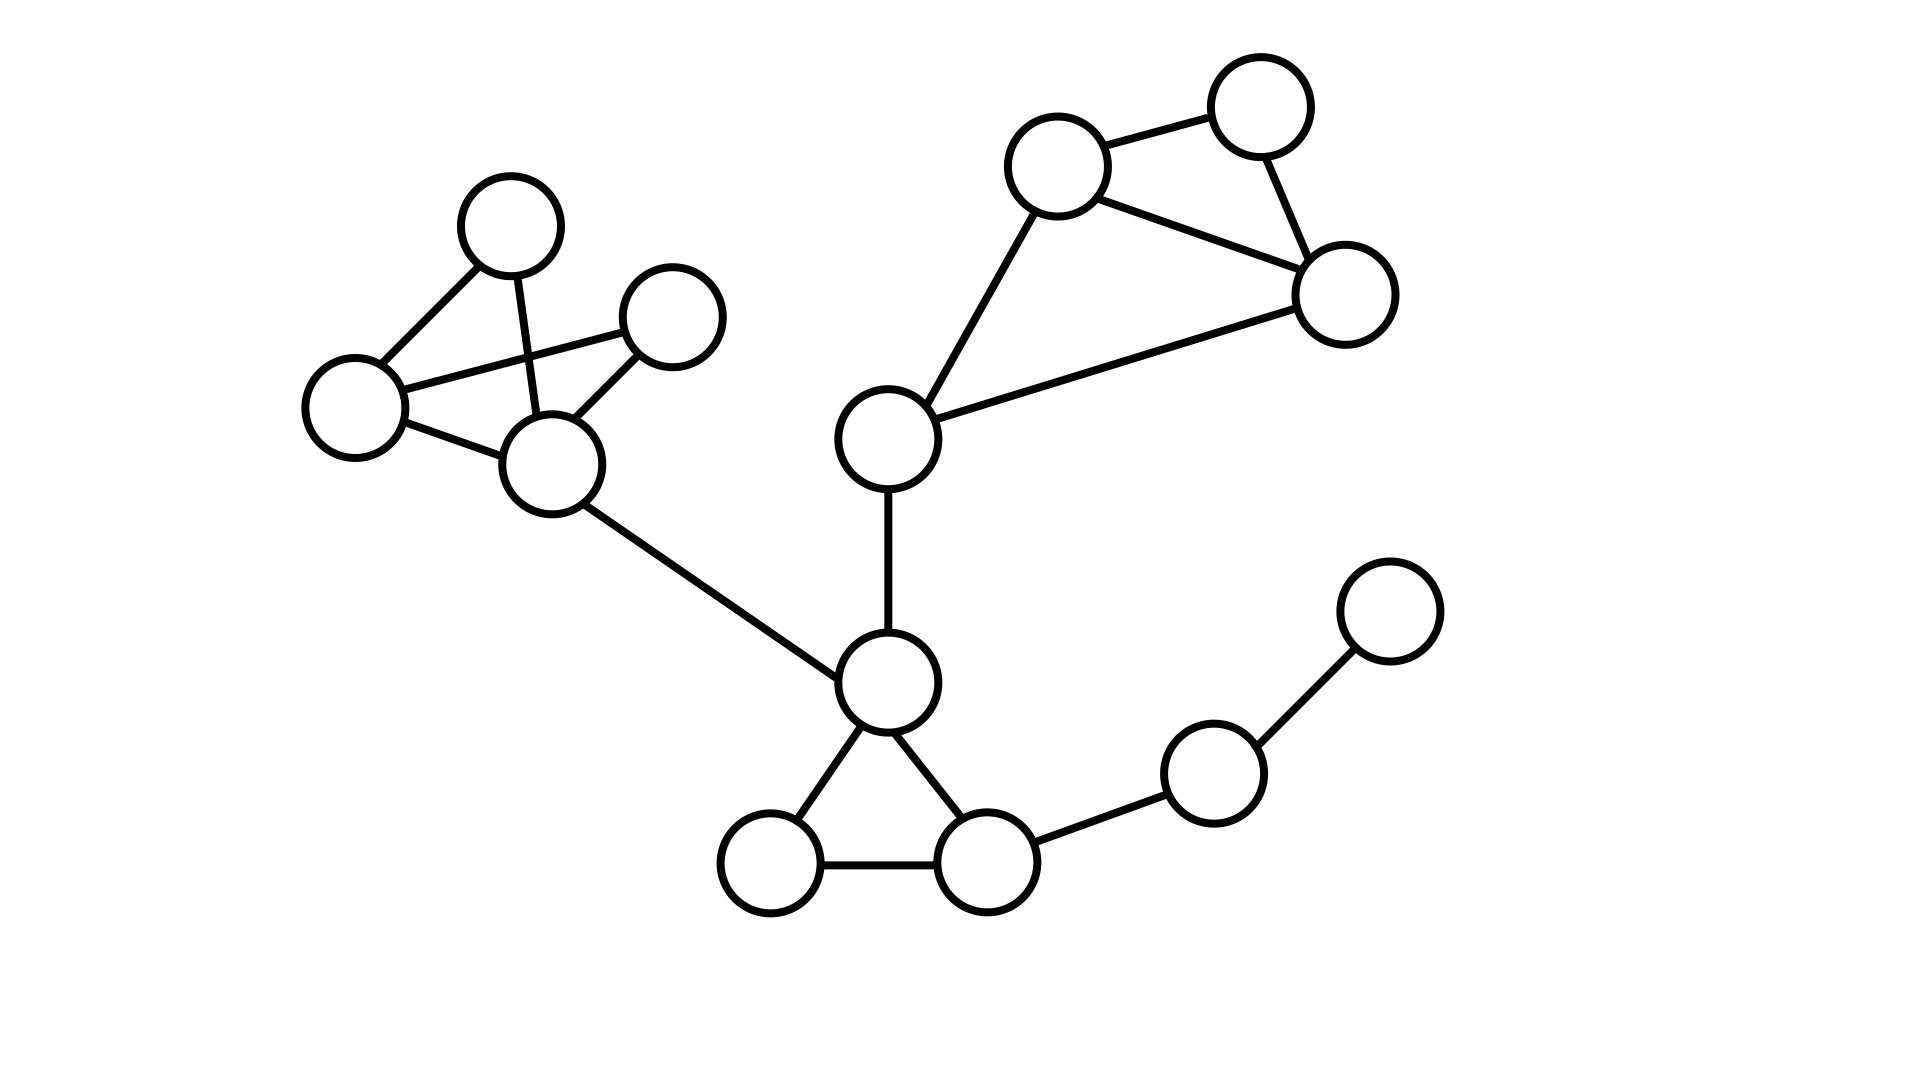
It is somewhat intuitive to say there is three, maybe four different partitions to this graph, but how can we codify this suspicion?
Simple Modularity
Well one way would be to say there should be more relationships within a cluster than between clusters. I think that is a very simple way to think about what we mean when we say a cluster within a graph. Inherently nodes within a cluster should be more connected to each other than to nodes outside of the cluster. We can express it like so:
Now we have a ratio we want to optimize. And smarter minds are really good at optimizing so surely this will work, right?
Let's take a look at what this would mean with the three intuitive communities. We have a total of 17 different relationships or edges between all the nodes. Just looking at our graph we can see that there is only two edges that run between communities, so there is 15 edges that run within a community.
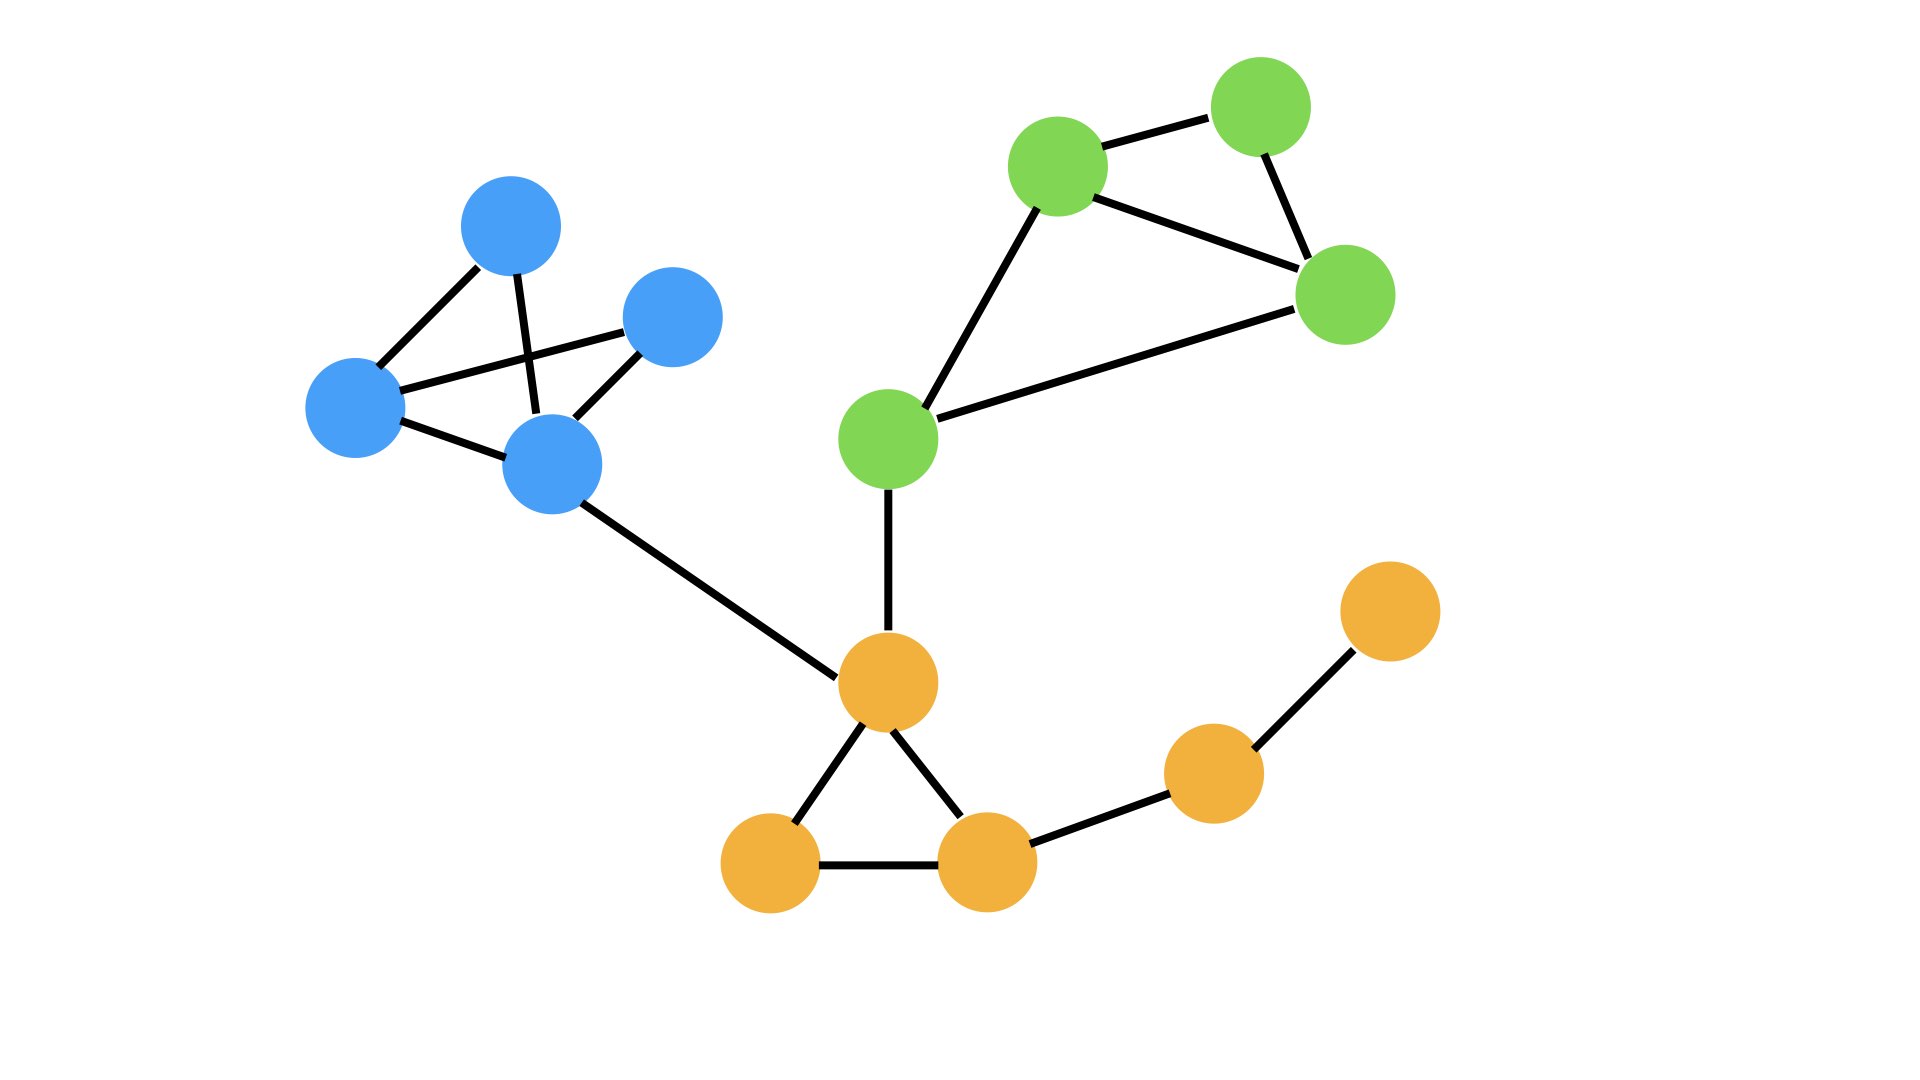
That means that we have a "modularity score" of 88%! Wow that's really high!
But what would happen if we brute forced our way through every possible combination of partitions. Could we beat 88%?
I guarantee it.
If we are looking to simply optimize this number that we would just put all nodes in one partition and have a modularity score of 100%. That will be true of every graph using our current understanding of modularity. But that's not very helpful at all, is it?
Actual Modularity
A good division of a network into communities is not merely one in which there are few edges between communities; it is one in which there are fewer than expected edges between communities.
— M.E.J. Newman
A data scientist's best friend is beating random chance. In general, if you are doing better than that simple measure, you are doing something useful.
The above quoted Newman fellow made this point. If we are the number of edges between communities is no better than random chance, than who would find that interesting? But conversely, if the number of edges between groups is much better than random chance, than baby, you got yourself a stew going.
So what is modularity now? Let's ask Mr. Newman again:
The modularity is, up to a multiplicative constant, the number of edges falling within groups minus the expected number in an equivalent network with edges placed at random.
Building a Random Baseline
What do we mean when we say "an equivalent network with edges placed at random." Well first we should set some parameters for what would constitute "an equivalent network."
- There should be the same number of nodes
- There should be the same number of edges
- The number or the weight of the edges coming off an node should be the same (this is called node degree)
- The edges between the nodes should be assigned randomly
Here is an example of what that might look like:
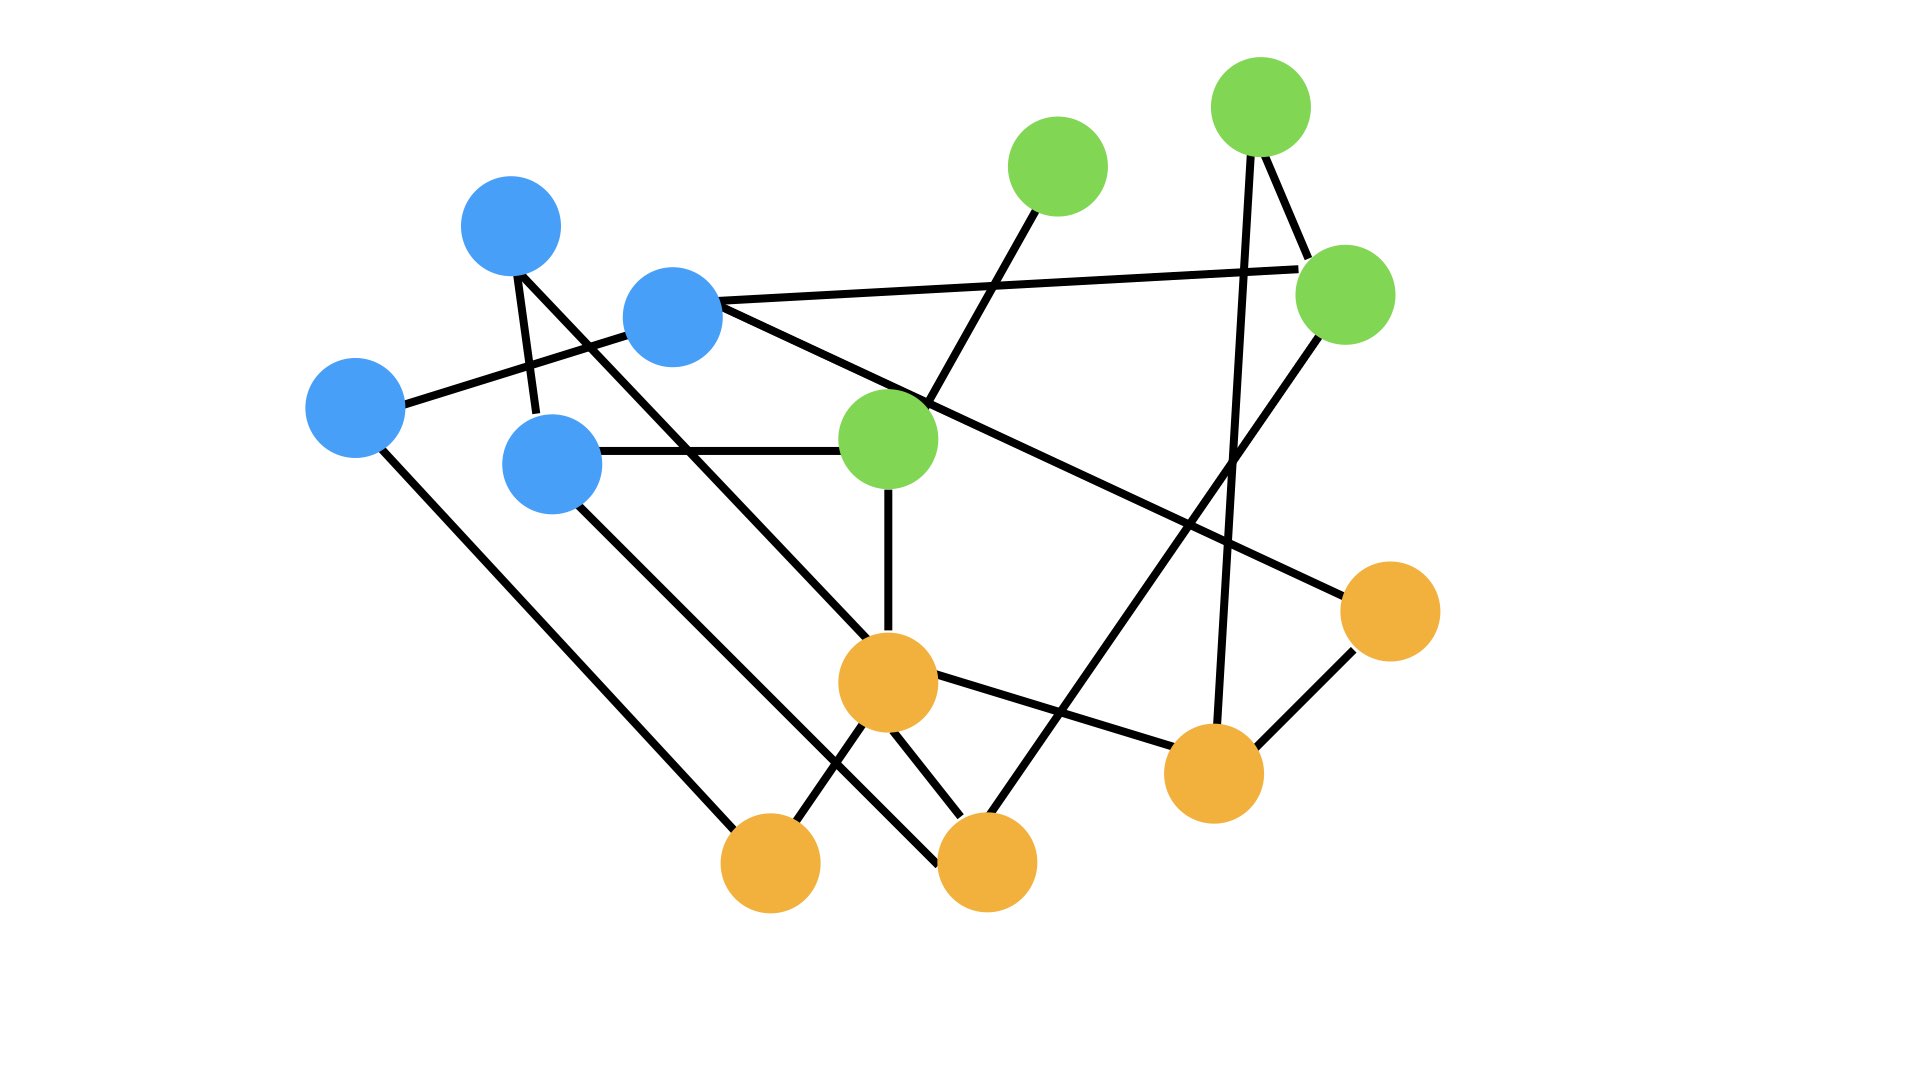
Note: I am building my little diagrams in powerpoint, so I will not be preserving the node degree but consider the picture as illustrative.
Basically, modularity will measure how much better of a job our clusters do in keeping edges within a community than between communities compared to this random equivalent graph.
Evaluating a Modularity Score
Modularity can fall between -0.5 and 1. A higher score indicates the presence of communities within our graph, and a lower score indicates the opposite.
Let's run through some different scenarios, remembering the broad formula of (edges within communities) - (random edges within communities).
- If there were only edges within communties and no edges between communities, than we would have a modularity of 1.
- If there were only edges between communities and no edges within, than we would have a modularity of -0.5.
- If there was the same number of edges within communities as there were random edges within those communities, than we would have a modularity of 0.
This actually helps solve our one big community problem. If the edges in a big community were distributed randomly than according to modularity, its no different than if they weren't. Thats because the number of edges within a community does not change, and thus, we have a modularity of 0.
Now we actually have a way to score communities. Next, we will cover how to optimize that score with Louvain.